The following article features Tableau 6
Power
Whether you are exploring your data for new insights, answering specific questions or even deciding what questions to ask, Tableau gives you unprecedented control to investigate, communicate and take action with the valuable information hidden in your data! Tableau has it all – a wide variety of options to graph your data, the ability to adjust your data so that you are using the right data in the right form for the questions at hand, and a user-friendly interface that’s designed around how people think about analysis, allowing you to follow your thoughts as you question and explore your data. You can work with every major data source, from Excel workbooks to the largest databases. You can even extract data from larger sources into a local “extract” file that will make your data exploration more efficient and allow offline analysis when you are away from the office.
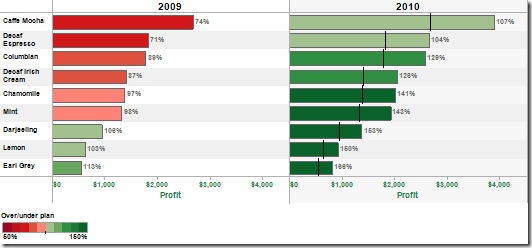
Profit and planned profit by product
Red is below plan, green is above
Percentage is actual versus plan
Black line in 2010 shows prior year profit amount

Displaying profit versus sales by region and customer segment Average profit ratio = size of bubble;
Minimum and maximum percents labeled per region
Colors are customer segments
Read more


