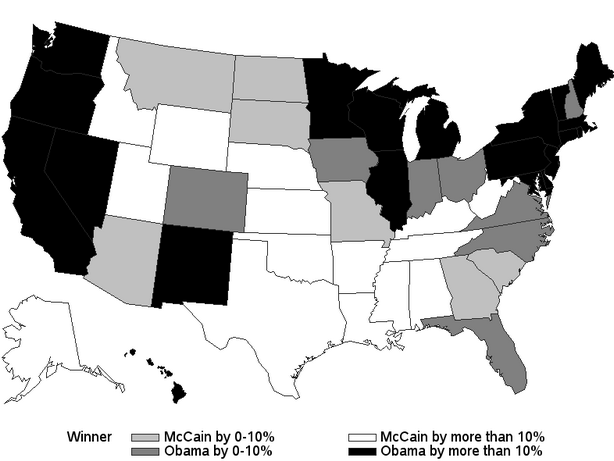
SAS 9.2 is a big leap forward in many areas. One of them is a variety of new graph types and easy access to creation in SAS Enterprise Guide 4.2. I think these two charts offer a fascinating look at the 2008 Presidential Election Results using SAS Maps and Tile Charts from the upcoming book, “SAS for Dummies”, updated for SAS 9.2 and available for purchase this Spring!
One of my favorite new examples added to the 9.2 edition of the book shows the 2008 presidential election results in two views: a map of the US with the winner by % margin of victory and a tile chart showing the state size, the winner and their % margin of victory. Due to the black and white nature of the book, these are shown in grayscale in the book and here on the blog.
2008 Presidential Election Results on a Map, Winner by State with Margin of Victory
