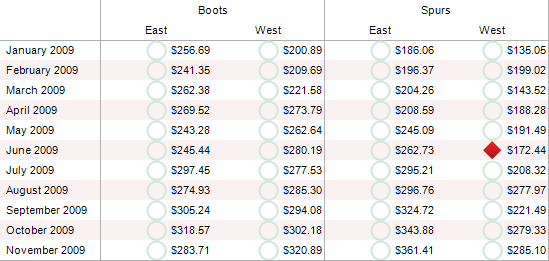
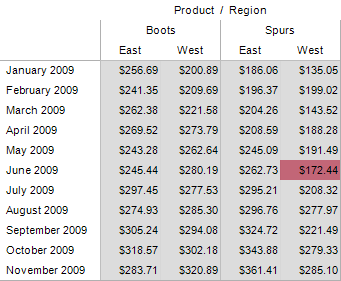
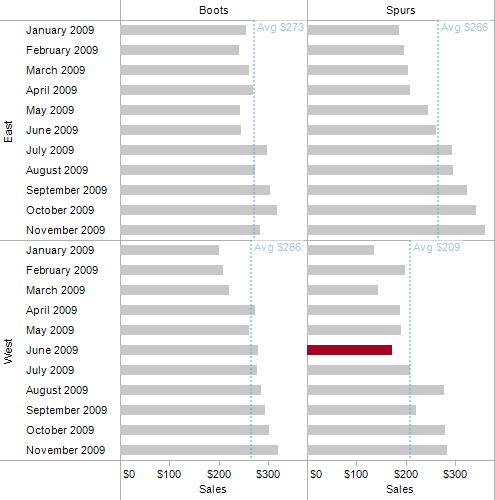
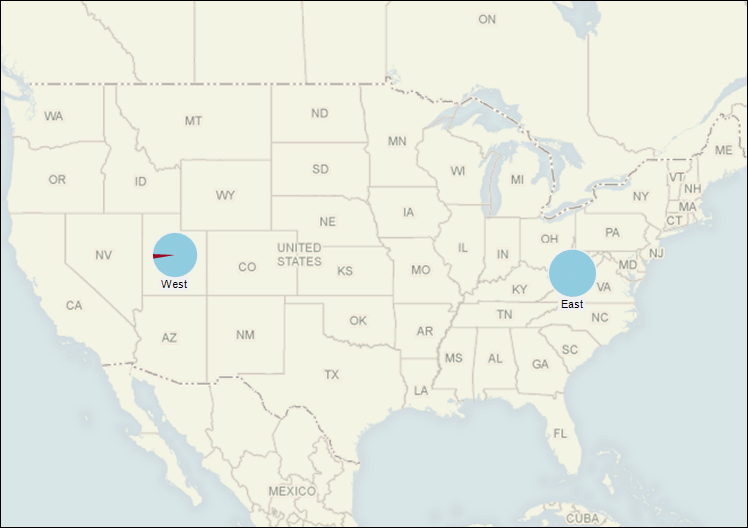
This workbook is an example of spotlighting in Tableau. Spotlighting involves applying user rules about data values to spot certain outcomes. With Tableau it is simple to apply basic to complex rules for spotlighting. This is beyond the standard highlighting capabilities available by placing measures on the color shelf.
As this example demonstrates, fairly complex rules can be used in Tableau to control spotlighting in simple calculated fields. Comments appear on the captions in each view (bottom of each view area in the Tableau workbook.)
This example was created in response to a question by KRees on Twitter. You can join Freakalytics on Twitter at http://www.twitter.com/Freakalytics.
Text Table Spotlighting Using Color and Symbols

You can download the Tableau packaged workbook here.
Note, certain browsers may recognize that the Tableau packaged workbooks (.twbx file type) are “zipped” file packages. As a result, the file type may be converted by your browser to .zip during download. If this occurs, simply correct the file extension to .twbx.
Securely share R shiny apps
Develop R shiny apps
All on one dedicated, secure and powerful platform.


