 |
 |
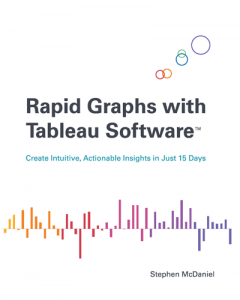
Reviews of Stephen’s latest book, “Rapid Graphs with Tableau”
“A great work — this is going to be a much loved book.”
Marc Rueter- Director of Sales Consulting, Tableau Software
“A must read for anyone interested in Tableau. Clear explanations, practical advice and beautiful examples…”
Elissa Fink – Vice President of Marketing, Tableau Software
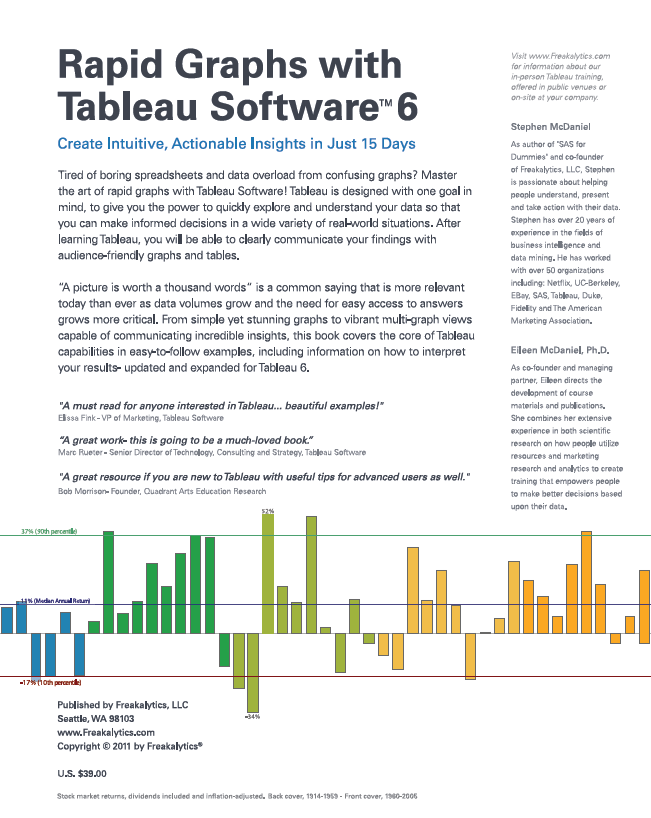
Back Cover Text
Tired of boring spreadsheets and data overload from confusing graphs? Master the art of rapid graphs with Tableau Software. Tableau is designed with one goal in mind – to give you the power to quickly explore and understand your data so that you can use your results in a wide variety of real-world situations. After learning Tableau, you will be able to clearly communicate your findings with audience-friendly graphs and tables.
“A picture is worth a thousand words” is a common saying that is more relevant today than ever as volumes of data multiply and the need for easy access to answers becomes more critical. From simple yet stunning graphs to vibrant multi-graph views capable of communicating incredible insights, this book will cover the extensive range of Tableau capabilities in easy-to-follow examples. Learn the scope and flexibility of this powerful application in just 8 days and go beyond the traditional limits of data presentation!
Please note, the cover image will take several days to appear on Amazon. The back cover image of the book is lower in this post.
Gain a working knowledge and broad overview of the most powerful analytic platform- SAS!
Jonathan Koomey’s masterpiece on thinking and working analytically- truly exceptional for anyone interested in analytics!
Stephen Few’s latest work- merging the world of visualization and analytics brilliantly!
Stephen Few’s book on dashboard design- principles for good design that will inform and delight your audience!
This was the first book I read by Stephen Few. This helped change my thinking on how people perceive and process information. Using these principles also helped me to significantly improve my presentations and ability to explain complex analytic results in simple, actionable tables and graphs.
Securely share R shiny apps
Develop R shiny apps
All on one dedicated, secure and powerful platform.