(NOTE– you can click on any image to see a larger version of the view.)
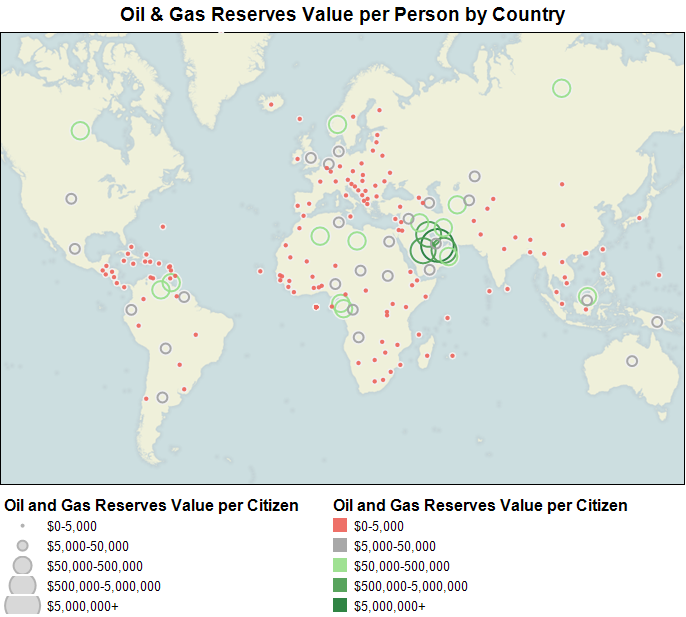
Examine this map of the world by average wealth per capita based on proven oil and natural gas reserves. Notice that the color and size legends encode the same information. Each larger wealth group is approximately 10x the prior group.
Countries that are prominent in this map are those likely to have very significant motivation to keep petro-energy interests at the top of our political agenda. Unfortunately, they also tend to be countries that are fairly unstable politically for various reasons. Canada and Norway stand out as notable exceptions to the instability issue.
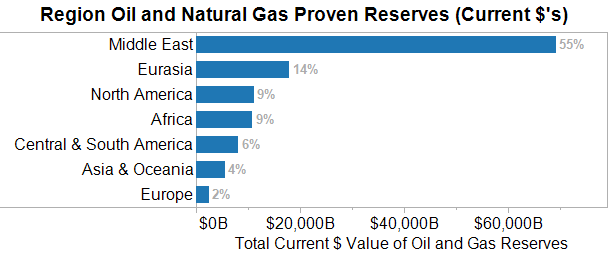
It is common knowledge that there is a massive concentration of petro-wealth in the Middle East. Less commonly known is that Eurasia is 2nd with North America and Africa tied for 3rd place. Europe, with all the Brent Sea attention in the news, is dead last. No wonder they are so aggressive about pursuing energy neutral buildings and towns over in Denmark!
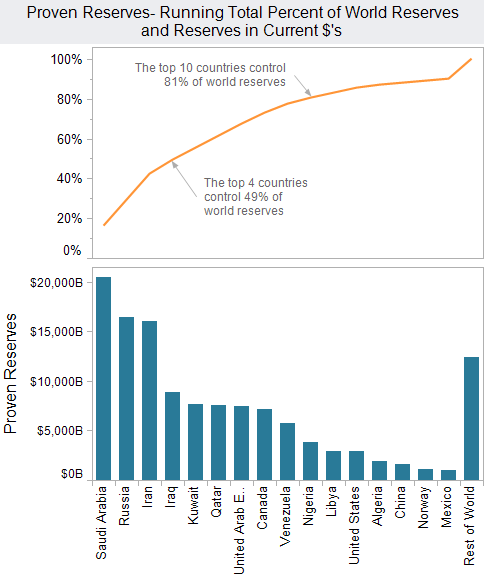
The majority of oil wealth is concentrated in just a few countries, with 81% of all wealth controlled by just 10 countries! Saudi Arabia’s petro reserves alone are equivalent to 35 years of US defense expenditures or the market capitalization equivalent of three times (3X) all companies on the New York Stock Exchange (as of July, 2009)!
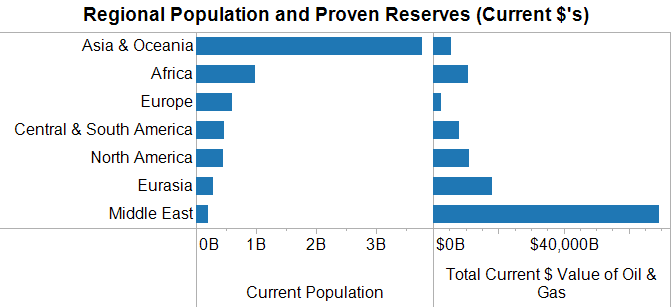
Without alternative energy systems, a massive wealth transfer will continue from more populated regions of the world to a subset of the less populated regions. Asia will continue to be very dependent on the Middle East, Africa and Eurasia for growth to continue in the coming decades.
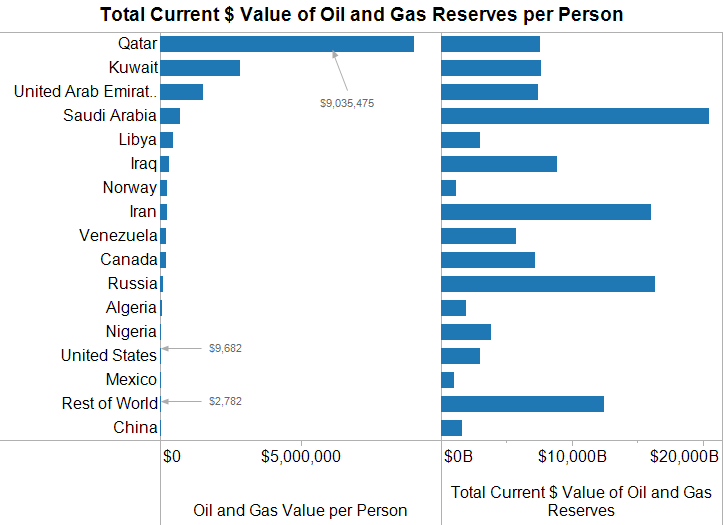
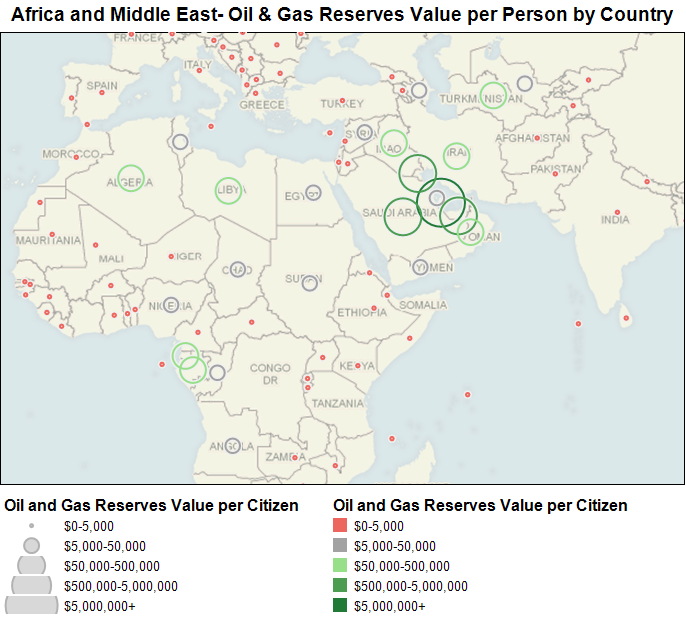
Thinking about a retirement@f8 In certain countries, there is no need to really think about retirement or even working very much. While Saudi Arabia is frequently discussed due to their overall reserve size, countries like Qatar, Kuwait and UAE are so incredibly wealthy that no one will likely need to work if the government equitably shares their petro assets with the population. What impact might such incredible wealth concentrations have on political lobbying efforts, wars and sentiment toward these countries@f9
Even the 3rd richest per capita country in petro-wealth, UAE, has a wealthier lower class (assuming the citizens receive 50% or so of the wealth value) than the top 5% of wealthiest Americans, absolutely amazing! See Rich-o-Meter 2.0 at the WSJ for Americans wealth by percentile ranking.
Interesting Metrics Used in this Article
Total Current Value of Oil and Gas Reserves — instead of discussing barrels of oil and cubic feet of gas, this presentation focuses on the economic value of proven oil and natural gas reserves based on current market prices as of September, 2009.
Oil and Gas Reserves Value per Citizen– dollars of wealth per capita based on proven oil and natural gas reserves based on current market prices as of September, 2009.
Data Notes
- Valuations ignore cost of extraction and transport of assets to buyer. This is typically 10-30% of the value of the oil and gas reserves.
- World oil reserves are in a significant state of decline. See the poorly captioned article in the NY Times, “Oil Industry Sets a Brisk Pace of New Discoveries” which highlights the 10-20 billion barrels of oil discovered each year over the past 9 years. Unfortunately, world consumption of oil has outstripped these “brisk paces” of new finds by 100-200% per year. Current world consumption of oil is near 31 billion barrels of oil, which is pointed out in the article.
- Many countries have “maintained” very stable reserves despite massive consumption of resources with no significant finds for many years. OPEC countries in particular have a strong incentive to overstate reserves as this determines how much oil they are permitted to sell on an annual basis.
- Data sources include EIA (US DOE) and US Census Bureau. All values are based on data for years 2007 or 2009.
About Metrics to Inform
Public debate often focuses on very simple metrics to explain topics of great importance in public life. In the “Metrics to Inform” series, Freakalytics shows how careful selection of relevant metrics can greatly enhance understanding of important issues. Eileen and I frequently discuss recurring problems with the simplistic metrics and analyses used in the news (similar problems also exist at many companies!) We hope that you will find this series useful both in your understanding of critical public issues and expanding your thinking about business metrics in a fresh, new light.
Securely share R shiny apps
Develop R shiny apps
All on one dedicated, secure and powerful platform.