This example has been a long-time favorite of our training attendees and consulting clients. It covers the history of WalMart in the US from inception through 2006. Using the filters and interactions with the dashboard, you can examine this data from a wide range of angles.
For example, using the decade slider, look at the first decade (62-72) of WalMart’s existence. The locations are centered about Bentonville, Arkansas, where WalMart was founded. Also, note the orange distribution center close to the center of the growth in the first decade.
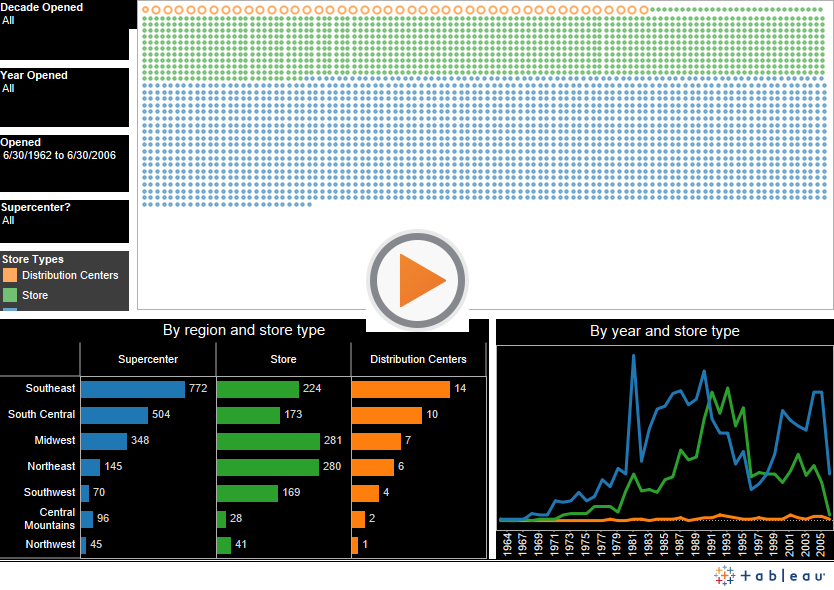
Now, go to the next decade (73-82), when WalMart became a publicly traded company. Two more distribution centers were added and you can see how vital they are to growing into new regions including Texas, Mississippi, Alabama, Tennessee, Georgia and South Carolina. Also, note that the separation of store types, Supercenter and Store, is a reflection of what these stores will eventually become, not necessarily what they were when first opened. In fact, Supercenters were first launched in 1988. Reset the decade selector to All.
For one more example, click the header for Supercenter in the bottom left bar chart. Note the distribution of these locations on the map. Now, click the Store header in the bar chart, contrast these clusters with the Supercenter locations.
The possibilities are many with this type of dashboard. In fact, I have built this dashboard over 40 times in front of classes as they learned how to build it. Not once have I created the same dashboard, there are so many angles to approach this type of data and areas to focus upon.