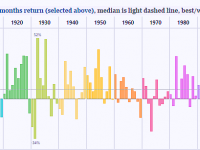
 Economic Indicators and S&P Composite Returns
from 1901-2008
A Dashboard to Explore Past, Present and Future Results
When creating a dashboard, two critical questions to ask include, “what are the right metrics” and “what collection of graphs will optimize exploration and understanding from a complex relationship between multiple metrics”? This example uses historic economic and stock market data to explore these concepts and to provide powerful insights into stock market patterns relative to economic conditions. This interactive dashboard is powered by tableau public, a new service of Tableau Software. One means of interacting with this dashboard is data point brushing, highlight data in a part of the dashboard by single-clicking and dragging