December 30th, 2013
Stephen McDaniel
Chief Data Officer Advisor at Freakalytics, LLC
Finding it hard to make time to keep up with the rapidly changing world of data, data warehousing, analytics, data science, business intelligence and visual analytics? We understand! Here’s our curated summary of relevant news that could help with your future data and analytic projects. We also add commentary on the topic, a summary of the article (in orange) and the link to read the full article.
There are four articles in this update:
Why Do Forecasters Keep Forecasting?
2014 BI Outlook: Who’s Hot, Who’s Not
Where do you sound like you’re from? (How Y’all, Youse and You Guys Talk)
Aided by Data Analytics, Internal Auditors Dig Deep
 Why Do Forecasters Keep Forecasting?
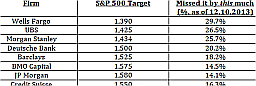
I found this article quite interesting, a wide range of investment advisors missed the forecast for the growth of the S&P stock market index in 2013, all of them by a huge amount (a range of being off by -53% to -109%)! This shows how incredibly difficult forecasting even one year out can be, in spite of these companies having entire teams of experts constantly studying every machination of the underlying data that affects the stock market including economic factors, political climate and more. In fact, if forecasters at many retailers were off by so much on their overall company sales growth forecasts, they would likely be sacked or at least pummeled with a bag of oranges in the garage one dark evening!
Why is this article so important? Because there has been tremendous hype around the power of predictive analytics to steer the business. The reality is that forecasting is an incredibly hard job, regardless of the overall intelligence, toolset, access to data and experience of the team. Does this mean we should give up on forecasting and using advanced methods to predict future outcomes and behaviors? No! However, it does imply that forecasting should be fluid and adjusted, sometimes rapidly, in response to changing external factors.
All of this begs the question, how can someone do this? In my opinion, it points back to visual analytics, dedicated teams of business analysts with clear missions and good data management and warehouse practices with an agile approach, so that major misses can be caught, reviewed and corrected mid-course.
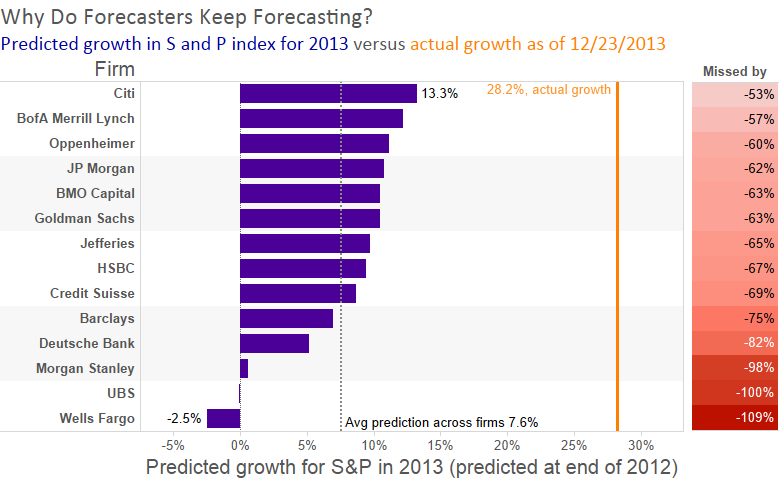
I created my own summary dashboard of the growth forecasts (image above.) Imagine if you were a client of these firms and you were told in late 2012 that stocks would lose money in 2013 (Wells Fargo and UBS), so you buried it all back into low-yield bonds! In the words of Warren Buffett, “Buy when everyone else is selling.” Of course, these stock analysts offered a hint that 2013 might be a good year to invest, since the average of their growth forecasts were 7.6%, well below the historic returns of 11.3% since 1928.
Regardless, the true danger of forecasting is not that you will be wrong — the odds are you will — but rather the natural tendency to stick to a forecast regardless. Instead of adjusting to changing conditions, we have the odd tendency to marry the old prediction…
 2014 BI Outlook: Who’s Hot, Who’s Not
(The Dangers of Surveys with Small Sample Sizes)
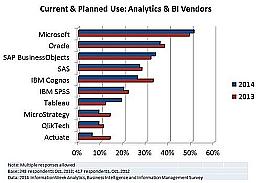
I targeted this article to review predictions about the growth in usage for leading business intelligence vendors. While I found it interesting, there’s a lack of rigor in the analysis that is a common problem when using surveys at many companies- misinterpreting trends from surveys based on small sample sizes.
The survey in this article had 248 respondents in 2013 and 417 in 2012, yielding a margin of error for intended usage of products for each company of +/- 6.5% in 2013 and +/- 4.8% in 2012. Since many of the year over year differences for each company is less than the sum of these margins of error (e.g.- Qlikview was down from 11% to 8%, yet the margin of error made the interval for 2012 6.2% to 15.8% and for 2013 1.5% to 14.5%- both of these contain the point estimate for each year, so there could be no change or even an upward move!) Because of this, we should tread lightly about any final conclusions of growth for all but a handful.
Another common problem that is likely to have significantly affected the results of the survey are selection bias, or the tendency of self-selection in this case, which would likely skew to departments/companies that are making a change in their technology. These companies, by virtue of looking at new technologies, would be much more likely to find the survey and take it as they researched their decisions. Additionally, people looking at new technologies likely already have existing (more established) technologies.
Does that mean the survey should be ignored? No, but we should probably supplement it with other data. I went to Google Trends, which allows you to research what people search for by keyword. I used basic searches of Google Trends for each company/products in the Information Week survey and analyzed United States data for multiple years. Google does not tell us exactly what the units are, but we can compare across different search terms for an index value, showing their relative importance as well as their rough growth.
 Click here to read the full Freakalytics analysis, 2014 US growth forecasts of Business Intelligence vendors.
Which analytics and BI products are you using, planning to use, or evaluating? We’ve put this question to survey respondents every year, so we can track changes over time. The biggest gainer in current or planned use compared to last year’s results was Tableau Software while the biggest slides were seen by Actuate, IBM Cognos, and MicroStrategy.
 Where do you sound like you’re from? (How Y’all, Youse and You Guys Talk)
Using an extensive survey to estimate which part of the US you speak the most like
This is a great example of applying the results of an extensive data set and “profiling” people (you, when you take the quiz) to categorize them into groups. A similar type of approach is used frequently in marketing analytics, whereby you use known data (often purchased or supplied by the prospective customer) to then categorize people into groups or segments.
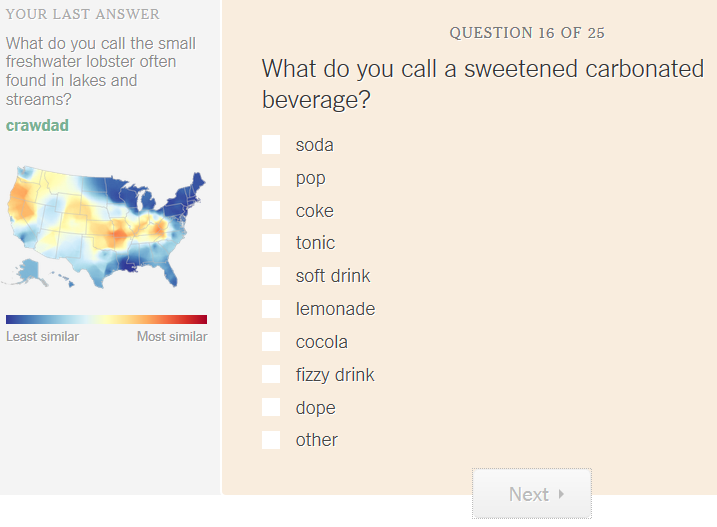
Here’s one of the quiz questions. I think they did a good job of keeping people engaged to actually finish the 25 question quiz by showing the result from each prior answer.
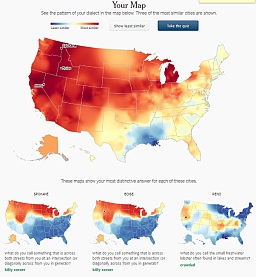
Here’s a summary of my results. Apparently, I sound like I am from the Idaho, Nevada, Washington state area! However, I grew up in Michigan and Alabama.

The data for the quiz and maps shown here come from over 350,000 survey responses collected from August to October 2013 by Josh Katz, a graphics editor for the New York Times who developed this quiz. The colors on the large heat map correspond to the probability that a randomly selected person in that location would respond to a randomly selected survey question the same way that you did. The three smaller maps show which answer most contributed to those cities being named the most (or least) similar to you.
 Aided by Data Analytics, Internal Auditors Dig Deep
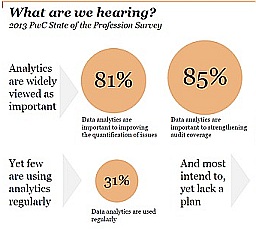
Data analytics enables auditors to do more with less, explains Vikas Agarwal, PwC’s managing director of data analytics. Indeed, if companies make the investment in data-analytic tools up front, they’ll see a greater return on their effort, he adds.
For internal auditors, the challenge is turning that data from disparate sources (financial, compliance, unstructured data like email, etc.) into meaningful information, Barnard says. However, when data analytics is applied to auditing practices, it can increase risk coverage, make the audit cycle more efficient, offer real-time data, help auditors manage risk and build a more collaborative organization.
![]() Follow Freakalytics on Twitter
Follow Freakalytics on Twitter
 RSS for Freakalytics.com
RSS for new course & webinar alerts
Subscribe to our newsletter