November 11th, 2013
Stephen McDaniel
Chief Data Officer Advisor at Freakalytics, LLC
 Finding it hard to make time to keep up with the rapidly changing world of data, data warehousing, analytics, data science, business intelligence and visual analytics? We understand! Here’s our curated summary of relevant news that could help with your future data and analytic projects. We also add commentary on the topic, a summary of the article and the link to read the full article.
There are seven articles in this update:
How Big Data Is Changing Science (and Society)
Big data blues: The dangers of data mining
2014 INFORMS Conference on the Business of Big Data
Facebook System for Massive Big Data (Hadoop FS) Offered Free to World
Paxata Launches Industry’s First Adaptive Data Preparation Platform
C-Suite and Trust Both Affect Financial Returns on Analytics, Big Data
Meeting a VAST challenge – Lincoln Laboratory staff create winning visualization
 How Big Data Is Changing Science (and Society)
Traditional statistical approaches that long dominated scientific research are being challenged and augmented by new approaches from the fields of big data and data science.
HOW CAN YOU PREDICT something without understanding it? Simple: Find some other phenomenon that tends to occur with the event you’re trying to predict. You may never know why your weekly poker buddy chooses to bluff on a particular hand, but his tell is a reliable indicator that he is, in fact, bluffing. With big data, it turns out that almost everything in nature and society has a tell, one that can be discovered with sophisticated computer models that run on inexpensive hardware and crunch through terabytes of data. If you measure enough variables, it doesn’t matter whether you understand the relationship between cause and effect; all you need is a relationship between one variable and another.
 Big data blues: The dangers of data mining
Examples in this article include Nordstrom, Urban Outfitters and other firms.
… while harnessing the power of data analytics is clearly a competitive advantage, overzealous data mining can easily backfire. As companies become experts at slicing and dicing data to reveal details as personal as mortgage defaults and heart attack risks, the threat of egregious privacy violations grows.
 2014 INFORMS Conference on the Business of Big Data
June 22 – June 24, 2014
A vendor-neutral conference run by the largest professional society in the world for professionals in the field of operations research (OR), management science and analytics. This conference is run by a mix of industry and academic experts. Note, Eileen and I are both on the Faculty of INFORMS.
How do you take the data you have and create actual business value?
Everybody’s talking about “big data”
…but few are talking about how you get from data discovery to return on investment. This intensive INFORMS conference puts the focus on business, with success stories and lessons learned on key issues like:
Identifying, storing, searching, cleaning the data you have.
Gaining insight from new data sources and data streams.
Selecting technology from all the options and solutions out there.
Going from just data-rich to data-smart.
Facebook System for Massive Big Data (Hadoop FS) Offered Free to World
Facebook found available Big Data technologies too slow for ongoing analyst needs and built their own system called “Presto”. After sharing it internally and offering glimpses of it to the world over the past year, Facebook decided to make this product open source and available freely to anyone wishing to use it. Of note, this system is capable of querying multiple systems simultaneously, not just Hadoop, using standard SQL commands. Other companies already using Presto include AirBnB and Dropbox. Testimonials include superiority over Amazon Redshift and Hive. Also, there appears to be much lower ETL overhead compared with competing approaches.
Presto allows querying data where it lives, including Hive, HBase, relational databases or even proprietary data stores. A single Presto query can combine data from multiple sources, allowing for analytics across your entire organization.
Presto is targeted at analysts who expect response times ranging from sub-second to minutes. Presto breaks the false choice between having fast analytics using an expensive commercial solution or using a slow “free” solution that requires excessive hardware.
Facebook uses Presto for interactive queries against several internal data stores, including their 300PB data warehouse. Over 1,000 Facebook employees use Presto daily to run more than 30,000 queries that in total scan over a petabyte each per day.
 Paxata CEO on startup success and data preparation
and also covered from another angle
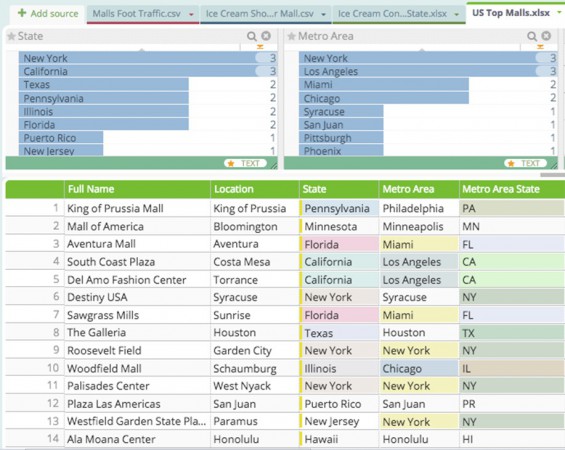
Paxata Launches Industry’s First Adaptive Data Preparation Platform
and about the process of creating Ready Data
Paxata Solution Overview
Paxata is launching a cloud-based platform to allow business users the ability to connect, explore, transform and combine their data for use in tools like Excel, Tableau, Qlikview and other business-user friendly tools. Paxata terms this process “Adaptive Data Preparation.” Eileen and I had the opportunity to hear Paxata CEO, Prakash Nanduri, speak at Strata last month and we were both impressed with his knowledge of the space, customer pain points and the customer panel assembled to testify about the solution.
Customer and partner references include Dannon, UBS, Pabst, Tableau and Qlikview. In our opinion, this space is a critical path area for many companies as self-service analytics embedded in the business spreads throughout every major industry.
Being a data analyst isn’t easy. Keeping information flowing for decision makers requires specialized knowledge and expertise at investigating patterns in raw numbers – but for the most part, it involves cleaning, changing, organizing and validating data for processing.
This tedious and largely manual task takes up as much as 80 percent of analysts’ time, according to Prakash Nanduri, the co-founder and CEO of Paxata.
 C-Suite and Trust Both Affect Financial Returns on Analytics, Big Data
(White Paper from IBM, registration required)
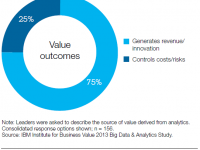
In this 30 page paper, IBM surveyed 900 business and IT leaders in over 70 countries about organizational issues that affect the success of analytics and data initiatives. Some of the more interesting findings include that analytics is valued more often for innovation/new revenues (75%) versus cost control. There is also a good section on trust in the data and people presenting analytic findings, especially how important the personal relationships are on action being taken based on the data. Companies cited in the paper include Nationwide Insurance, Celcom Axiata Berhad, Grupo Financiero Banorte and Westfield Insurance.
“In analytics, there are multiple data sources, multiple analytic messages and multiple analytic teams, each with an insight or recommendation or point of view,” he explained. “So what makes a (an internal data) consumer – whether on the frontline with customers or an executive – trust or rely upon one set of insights over another?” The answer, he said, often lies in the confidence the presenter has with the data, a familiarity with its nuances, for example, and the personal relationship between the two parties.
 Meeting a VAST challenge – Lincoln Laboratory staff create a winning information visualization
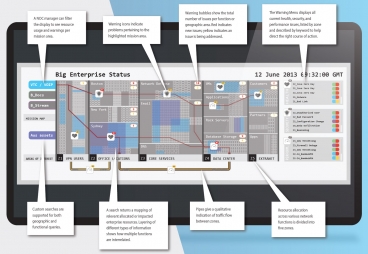
Researchers at MIT created an operational awareness display for Network Operation Centers, receiving honorable mention from VAST Challenge 2013.
The Laboratory team chose the “Situation Awareness Display Design” mini-challenge, which asked for a large-screen display that would allow the network operations center of a fictitious big enterprise to monitor and respond to the status of the company’s entire network of several hundred thousand computers located at geographically widespread branches.
“This challenge was an opportunity to apply visual analytic design skills without having to build a functional system,” …
“Users consume visual information in different ways,” says Staheli. “One group may prefer seeing everything at a glance, others may prefer the ability to choose what to see, and some groups may want the ability to interact with the information. Our design has some of all three elements.”
![]() Follow Freakalytics on Twitter
Follow Freakalytics on Twitter
 RSS for Freakalytics.com
RSS for new course & webinar alerts
Subscribe to our newsletter