 A client asked,
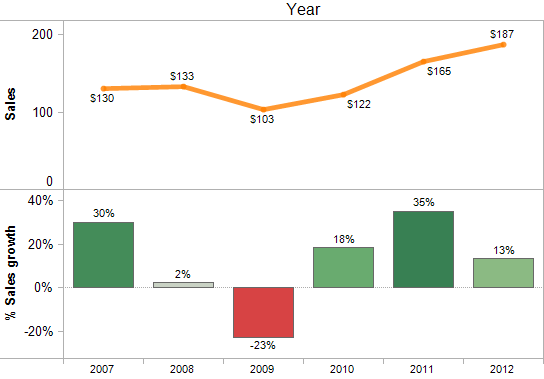
“What I want to show is a YoY (year over year) or WoW (week over week) comparison – however the first data point is always missing – even when the underlying data are available.
For example:
The full set of data shows a null value for 2006 – just because there is no data available to compute a comparison.
Now I want to move the date filter to start @ 2007 – and now 2007 has a null value even though we have data available to compute that metric.” What’s the issue and how can I display only years or weeks with growth rates?
Download this packaged workbook (Tableau 7) to see all the details and two solutions to this problem!
Topics in this example
1) Compare growth rates over time with quick table calculations
2) Filter time periods- doesn’t work as expected
3) Hide data values and show hidden data
4) Using table calculation data items as filters
5) Format labels to avoid excess precision and reduce their intensity with font color,
both increasing readability and comprehension
Securely share R shiny apps
Develop R shiny apps
All on one dedicated, secure and powerful platform.