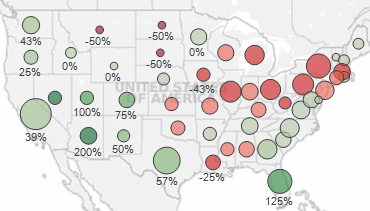
 A few observations from this example
Examining this dashboard with the initial decades of 1960 and 2010, you can see that the control of the House has shifted toward the West and the South. Exceptions include Louisiana, Mississippi and Oklahoma in the South and Montana in the West.
If you adjust the first decade slider to 1910, an even more dramatic pattern appears! People love the sunshine and the West coast with California, Florida and Nevada growth at 300%+ and Washington, Oregon, Utah and Colorado at 67% or more growth.
Dashboard topics in this example
Download the workbook to peek at a few cool features of this dashboard, including:
1) Using table calculations