#5 Examining data over time (7 ways with Netflix stock prices)
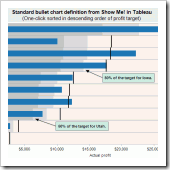
#4 Bullet charts & enhancements: making Stephen Few’s invention even better
#3 The Seven Developers of Tableau 7 — Tableau Customer Conference 2011
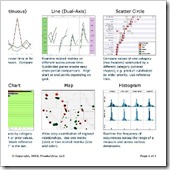
#2 Free graph & dashboard reference card on iPhone, iPad and Android
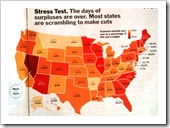
#1 Map dashboard, state budget shortfalls for 2011, just 30 minutes with Tableau
And Stephen’s personal favorite, the Freakalytics logo is animated and opens the Tableau Customer Conference in Las Vegas– all to the music of Journey!
Share the power of R shiny apps across the entire team with YakData
The team at Freakalytics has built YakData brightRserver, our new cloud platform.
Securely share R shiny apps
Develop R shiny apps
All on one dedicated, secure and powerful platform.
Securely share R shiny apps
Develop R shiny apps
All on one dedicated, secure and powerful platform.
Subscribe and keep in touch with us!


