A complimentary preview of the 1st two chapters, the table of contents and the book index is available for download here.
NOTE- the book is now available at Amazon, after correcting logistical issues.
Rapid Graphs with Tableau Software 6 is now available for purchase on Amazon in print and in e-book format for Kindle readers – on the Kindle device, PC, Mac, iPad and iPhone! Note that the print version has slightly better layout and readability due to the graphic-intensive nature of this book and the automated layout of e-book readers. This e-book is published in color for Kindle users on the PC, Mac, iPad and iPhone. Kindle device readers may have difficulty interpreting some of the graphs due to the native black and white reading experience.
This update from the 1st version of the book required changes across nearly every page and significantly expanded the size of the book with coverage of many new features added- both from Tableau 6 and earlier releases. Other additions include an index and expanded examples in several chapters.
Front Cover, available in print or Kindle e-book |
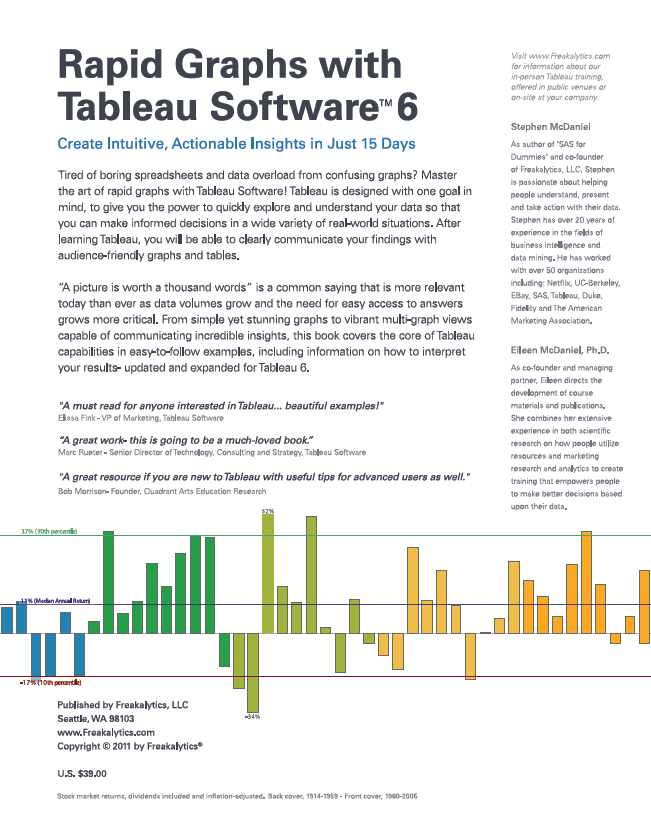
Back Cover, available in print or Kindle e-book |
Please visit the bottom of this page for expedited international orders using Creatspace. If you place an international order on Amazon, it is only available with standard shipping speed.
The sample data sources used in the book are available for download here.
Stephen McDaniel, Author
Principal Analyst, Freakalyticsâ„¢, LLC
Faculty, American Marketing Association
Eileen McDaniel, Ph.D., Author
Managing Partner, Freakalyticsâ„¢, LLC
Marc Rueter, Technical Reviewer
Senior Director of Technology, Consulting and Strategy, Tableau Softwareâ„¢
Cristy Miller, Cover Design
Senior Visual Designer, Tableau Softwareâ„¢
Table of Contents
Chapter 1
Tableau Software — how it can change your world
Power 2
Speed 5
Flexibility 7
Simplicity 9
Beauty 10
Chapter 2
Build the core: Tableau basics 11
Download, install and open Tableau 12
Connect to sample data and review the Tableau interface 14
Show Me! Tableau in action 18
Categorically clear views 24
Chapter 3
Go with the flow: more Tableau basics 31
Save time with the Tableau toolbar 32
When tables trump graphs 34
Insightful maps 38
View shifting- the underrated histogram and flexible bins 43
Exporting results to share your insights 49
Chapter 4
Essential view types in Tableau 51
Text Tables- an eye for detail 53
1. Text Table 53
2. Highlight Table 54
Heat Maps- how intense is it? 55
Bar Charts- six flavors to meet your needs 56
1. Aligned Bar 56
2. Stacked Bar 58
3. Side-by-Side Bar 59
4. Bar with Measure on Color 60
5. Histogram 61
6. Bullet Graph 62
Chapter 5
Advanced view types in Tableau_ 63
Line Charts- describe what happened recently 65
1. Line (Discrete) 65
2. Line (Continuous) 66
Scatter Plots- relationships matter 67
1. Circle 67
2. Scatter (Single) 68
3. Scatter (Matrix) 69
4. Dual Axis 71
Gantt Chart- understand the details over time 73
Pie Charts- by popular demand 74
Geographic Maps- what happened where? 76
Combination charts: overlaying multiple charts 77
Chapter 6
Taking over with Tableau – View structure, Marks Card, Summaries, Formatting and Titles 81
Customizing Views from Columns, Rows, Pages and Filters Shelves 82
1. Columns 82
2. Rows 83
3. Pages 83
4. Filters 85
Enhance visual appeal with the Marks card 87
1. Label 87
2. Text 88
3. Color 89
4. Size 91
5. Shape 92
6. Level of Detail 94
The Summary Card- rapid data insights 96
Headers and Axes 97
Titles, Captions, Field Labels and Legends 99
Formatting values in your Views 101
Chapter 7
Organizing the data in your Views- Sorting, Filtering, Aggregations, Percentages,
Spotlighting, Totals/Subtotals, and Motion Charts 103
Simple and advanced sorting of views 104
Simple and advanced filtering of views 107
Aggregations for measures- specify the right summaries 109
Percentages provide balance to compare ratios 111
Spotlighting your View to call out important values 112
Totals and Subtotals to sum up parts of your view 114
Motion Charts with Advanced Page Filter Feature 116
Connect to Data Source, step-by-step 116
Chapter 8
Quick Calculations, Custom Table Calculations, Reference Lines and Trend Lines 123
Quick Table Calculations 124
Custom Table Calculations using data in your views 125
Reference Lines, Bands and Distributions 133
Model your data with Trend Lines 136
Chapter 9
Data items and data management in Tableau 143
Data items: names, types, roles, properties, attributes and hierarchies 144
View Data- understand the detail behind the view 158
Dividing numeric data items into intervals using bins 159
Grouping dimensions into categories 161
The power of sets to combine and filter your view 164
Chapter 10
Advanced data management in Tableau 167
Calculated Fields, Functions, and Parameters 167
Calculated Field Operators 170
Numeric Functions (Singular) 171
Character Functions (Modify Items) 172
Character Functions (Locate Values in String) 173
Date Functions 174
Type Conversion Functions 176
Logical Functions (If, Then, Else) 177
Aggregate Functions 178
Table Calculation Functions 179
Parameters add additional control for your analysis 180
Chapter 11
Advanced data management in Tableau 183
Managing data connections 183
Queries to retrieve the data you need 184
Data blending to use data from multiple sources in one view 188
Extracts to accelerate your data exploration in Tableau 193
Chapter 12
Sharing your insights from Tableau 197
Exporting Images to other applications 198
Exporting Data to other applications and even back to Tableau 200
Print to PDF- export your views to Adobe Acrobat format 204
Packaged Workbooks- take Tableau on the road! 204
Tableau Reader- share packaged workbooks with your colleagues 206
Tableau Server- powerful insights for everyone! 207
Tableau Desktop and Tableau Server 208
Tableau Public —freely share your visual insights with the world! 210
Appendix – Timesaving Tips
Stephen’s list of valuable keyboard shortcuts 212
Standard Toolbar navigation shortcuts 213
Index 215
Back Cover
Tired of boring spreadsheets and data overload from confusing graphs? Master the art of rapid graphs with Tableau Software! Tableau is designed with one goal in mind, to give you the power to quickly explore and understand your data so that you can make informed decisions in a wide variety of real-world situations. After learning Tableau, you will be able to clearly communicate your findings with audience-friendly graphs and tables.
“A picture is worth a thousand words” is a common saying that is more relevant today than ever as data volumes grow and the need for easy access to answers grows more critical. From simple yet stunning graphs to vibrant multi-graph views capable of communicating incredible insights, this book covers the core of Tableau capabilities in easy-to-follow examples, updated and expanded for Version 6. Experience the scope and breadth of this powerful application in just 15 days and go beyond the traditional limits of data presentation!
“A must read for anyone interested in Tableau. Clear explanations, practical advice and beautiful examples!”
Elissa Fink — VP of Marketing, Tableau Software
“A great work- this is going to be a much-loved book.”
Marc Rueter — Senior Director of Technology, Consulting and Strategy at Tableau Software
“Well written, easy to use book that has something for everyone. Great resource if you are new to Tableau… but also useful tips for advanced users as well.”
Bob Morrison- Founder, Quadrant Arts Education Research
About the authors
As author of “SAS for Dummies” and co-founder of Freakalytics, LLC, Stephen McDaniel is passionate about helping people understand, present and take action with their data. Stephen has over 20 years of experience as a teacher, consultant, leader, innovator and author in the fields of business intelligence and data mining. He has worked with over 50 organizations including: Netflix, UC- Berkeley, EBay, SAS, Yahoo!, Duke, Amgen, Fidelity, The University of Washington, Target and Microsoft.
As co-founder and managing partner, Eileen McDaniel directs the development of course materials and publications. Eileen combines her extensive experience in scientific research on how people utilize resources with her education and consulting work in marketing analytics to create training that empowers people to make better decisions based upon their data.
Available at Amazon for US orders and standard shipping speed international orders.
This book is available direct from our printer at CreateSpace for expedited international orders. Please note that international shipping times range from 6 to 25 days, based on shipping priority selected at checkout.
Securely share R shiny apps
Develop R shiny apps
All on one dedicated, secure and powerful platform.
