 Chris Stolte, Chief Development Officer, Tableau (co-founder, Tableau Software)- on-stage
Dan Jewett, VP of Product Management
Francoise Ajenstat, Director of Product Management
Some comments are the opinion of Freakalytics and not necessarily those of Tableau
This content is live blogged; there may be occasional errors or omissions.
Overview
Mission of dev team- “Help people see and understand their data.”
Make data fun, anathema too many, but key to using data throughout the organization and entire decision-making process
Four key areas of investment for 6.1
Data performance
Sharing via mobile optimization with iPad
Localizing and globalizing the products- French and German
User experience- make every step easy, fast and fun!
Data architecture
Live connection to any data source that is already working at your company
– Continue to invest in this approach, very important
Unfortunately many people have data everywhere- Excel, CSV, text, tab-delimited, Access, some data marts, etc. We want to make it easy for these people to also use their data!
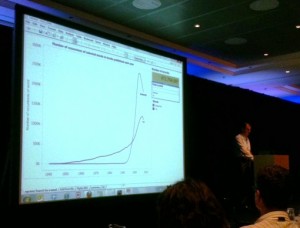
1st example- 500 million words from Google books project, examining use of various words. Results came back on his desktop in 5-10 seconds with 500 million records over 70 years. NO DATA WAREHOUSING, just load your data into the extract!
Realized that you might want incremental additions to Tableau Data Extract. Dynamically loading Tweets on conference. Chris had data through 11 AM, but it is now 1:30 PM, he told the extract to refresh just data since 11 AM using the date time field.
You might have data from your data warehouse. But it isn’t uploading as frequently as you would like. Tableau can add data to the extract from —another— source, not just the original data source! e.g. – Monthly files are standard from database, but I have a critical weekly addition from a comma delimited file. Can easily add it to the extract.
Many other new data features in 6.1
Faster extract creation with text files
Faster queries
Impersonation for SQL Server
Teradata LDAP authentication
Initial SQL when connecting to Teradata
Localization and Globalization
German and French now available in their language
Also expanded geocoding,
– Worldwide cities, more than 15,000
– Post codes for almost all countries
– Fields natively supported in your language! (e.g.- US cities in German language)
– Even the map labels automatically adapt to your language and locale
– Workbook locale for dates, numbers, etc.
User experience
Pin and unpin from start page, clean up start page
View Data everywhere- data connections, custom SQL, at top of data pane- a commonly requested feature by accountants, financial people
From View Data you can now pick just part of the data- for example just some people’s names instead of all the data in the columns
Next feature from web site forums- refresh all extracts in workbook, new command on Data menu instead of individually selecting them
Improved pan and zoom on maps and charts
Links for dashboard images
Author control of legend layout
Dark map style with black background
iPad dashboards and more!
Rich visual analytics
Touch optimized for gestures
Consistent layout
Author once and work anywhere
Focus on many platforms, not just iPad direct with Tableau application
BUT should also work with regular web access
Automatically can tell on iPad
Interaction is awesome and smooth like an iPad app
Hard to tap right values in a filter list, it automatically gives you a touch optimized quick filter
Couldn’t easily multi-select before, but now I can hold down my finger to multi-select from a viewer
Actual app store application, regular web interface for login
Fun seeing our dashboard in the Tableau demo!
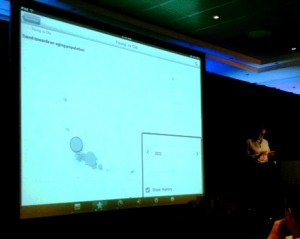
Pages example like the Hans Rosling TED demo
Authoring content for mobile platform- very easy and effortless, just like any other content!
Interactions subtly different, but in each platform- Windows desktop, Windows browser, iPad browser, iPad Tableau app.
Even on Windows browsers, new iPad features like gestures were carried over for pan/zoom/selection for end-user experience.
Securely share R shiny apps
Develop R shiny apps
All on one dedicated, secure and powerful platform.