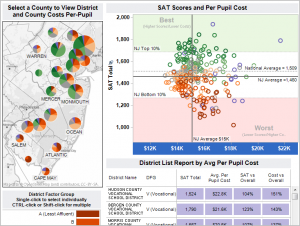
 This dashboard provides a comparison of per student spending with performance on the SAT exam based on the 2009 New Jersey Report Card data. DFGs are based on economic and demographic data. These are assigned by the New Jersey State Department of Education.
This work was created in collaboration with Bob Morrison of Quadrant Arts Education Research. Bob has extensive experience with helping school systems measure educational results related to how and where funds are spent. I have a great admiration for Bob as a passionate advocate for growing both music and arts education. Bob has expertise in advocating on behalf of students around the many ways that music and arts education can engage students and improve their academic performance.
Securely share R shiny apps
Develop R shiny apps
All on one dedicated, secure and powerful platform.