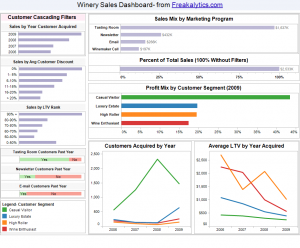
 This dashboard, a Customer Sales Dashboard for a boutique winery, offers one strategic view of key questions asked by winery management. Information such as amount of sales attributed to various marketing programs, estimated profits by customer segment and number of customers acquired during each of the last four years is displayed.
Using a series of cascading filters based on key customer attributes
Read the rest of this entry and view the dashboard
Share the power of R shiny apps across the entire team with YakData
The team at Freakalytics has built YakData brightRserver, our new cloud platform.
Securely share R shiny apps
Develop R shiny apps
All on one dedicated, secure and powerful platform.
Securely share R shiny apps
Develop R shiny apps
All on one dedicated, secure and powerful platform.
Subscribe and keep in touch with us!