 View and interact with the strategic customer sales and analyst exploratory dashboards below, both hosted by tableau public.
Read Eileen’s white paper, “Visual Management of Marketing Programs“, for detailed explanations on maximizing Marketing ROI with visual marketing dashboards.
In this case study, we used customer demographic and sales databases from a boutique winery in combination with Tableau Software, an innovative and intuitive data visualization product, to uncover information vital to designing a dynamic, cutting-edge marketing program.
We developed a segmentation scheme in which we assigned each customer to a segment, which the winery can use to more effectively target customers with segment-specific marketing efforts. We also estimated lifetime value (LTV) to quantify the estimated future spend of each customer, so the winery can adjust the messaging and costs of marketing campaigns based upon the recipient. To top our wine glasses off, we integrated customer segmentation and LTV to create a multi-dimensional view of each customer to maximize the winery’s Return on Investment (ROI) from the marketing program.
The final step was compiling a complete, visual report of this information for the winery’s management. Using Tableau, we developed two dashboards to display crucial results obtained from our work with customer segmentation and LTV estimates. With Tableau, it is easy for users to apply filters to highlight areas of interest; for example, only customers who spent more than $5000 in the tasting room or information about Wine Enthusiast customers.
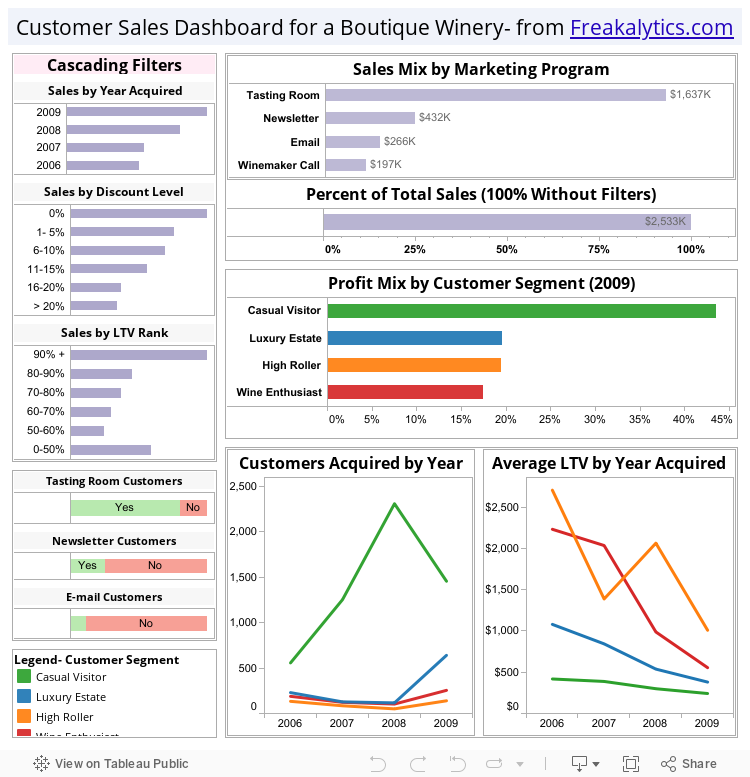
The first dashboard, Customer Sales Dashboard for a Boutique Winery, is a strategic view of key questions asked by winery management. Information such as amount of sales attributed to various marketing programs, profits divided by customer segment, and number of customers acquired during each of the last four years is displayed. Using a series of filters, users can control the view by displaying or hiding various subsets of customers.
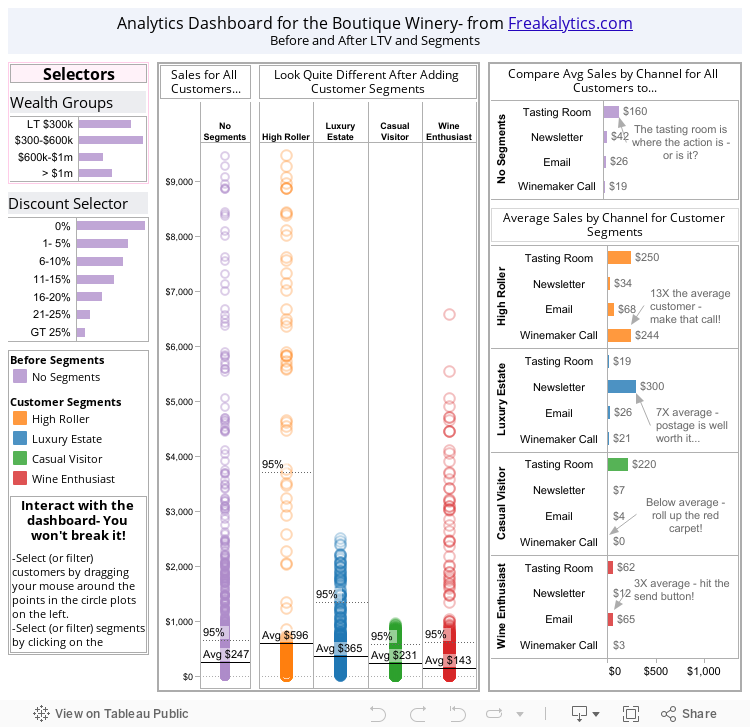
The second dashboard, Analytic Dashboard for a Boutique Winery, is aimed at the marketing analyst, enabling her to plan and fine-tune the marketing program by finding relevant insights rapidly. The dashboard has four components: 2009 LTV and customer counts divided by segment, sales by different channel separated by segment, the change in LTV between 2008 and 2009 for each segment, and the relationship of LTV 2009 and tasting room sales. Users can choose from a variety of selector options to look at different customer groups.
The two dashboards provide key customer insights for the winery, enabling management to develop a fact-based strategic marketing plan based on the winery’s previous and ongoing marketing programs.
Download the full paper here.
Securely share R shiny apps
Develop R shiny apps
All on one dedicated, secure and powerful platform.