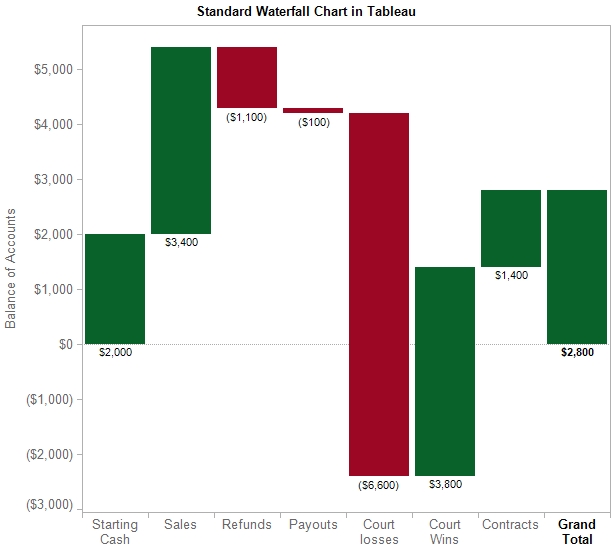
The 1st workbook walks you through building a standard Waterfall chart in Tableau. Waterfall charts are intended to show you how cash balances change over time based on transactions that either add to or subtract from the cash account of a business.
As this example demonstrates, many non-standard chart types can be created in Tableau using advanced features of the product. This chart type is a frequent request of students in our public and on-site Tableau training courses.

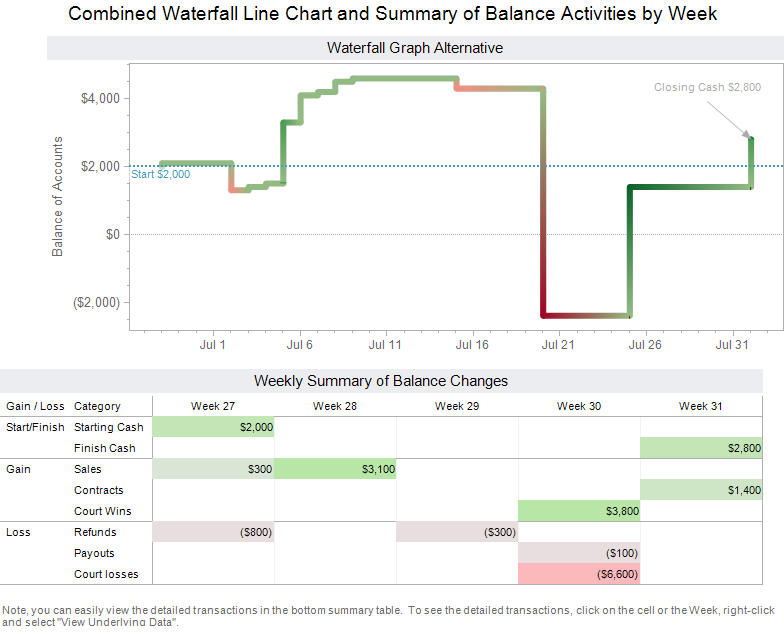
The 2nd workbook is an example of an alternative to a Waterfall chart built in Tableau. This is an extension to an alternative originally proposed in an article by Stephen Few (http://www.perceptualedge.com/articles/b-eye/reviewing_transactions.pdf). Follow the layout shown in the tabs of this workbook. Unfortunately, the improved alternative requires more data prep than the standard waterfall chart.

You can download the 1st (standard waterfall Tableau packaged workbook) here and the 2nd (superior alternative Tableau packaged workbook) here.
Note, certain browsers may recognize that the Tableau packaged workbooks (.twbx file type) are “zipped” file packages. As a result, the file type may be converted by your browser to .zip during download. If this occurs, simply correct the file extension to .twbx.
Securely share R shiny apps
Develop R shiny apps
All on one dedicated, secure and powerful platform.