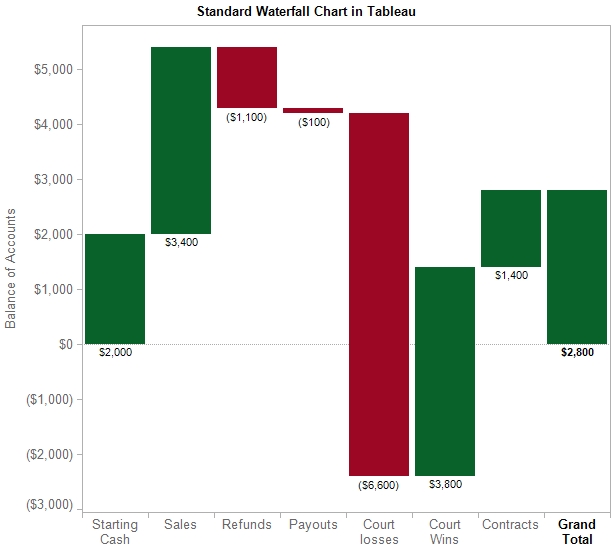
The 1st workbook walks you through building a standard Waterfall chart in Tableau. Waterfall charts are intended to show you how cash balances change over time based on transactions that either add to or subtract from the cash account of a business.
As this example demonstrates, many non-standard chart types can be created in Tableau using advanced features of the product. This chart type is a frequent request of students in our public and on-site Tableau training courses.
