Hands-on Data Visualization with R
 The open source programming language R is not just for statisticians and academics anymore! All types of data professionals—including business analysts, data scientists, and information technologists in a variety of business, government, and nonprofit organizations—are utilizing the power of R to analyze and visualize their data.
In this workshop, learn how to optimize new R packages to create high-quality data visualizations for your own use or to communicate key insights to colleagues and clients.
You Will Learn
+ Cutting-edge R packages that enable creation of customizable data visualizations for yourself or to share
+ How to build essential chart types based on a case study approach
+ How to create compelling data visualizations and explore possibilities to make them dynamic and interactive
Geared To
Data professionals with basic coding experience who are interested in the flexibility of open source technologies to create data-based visualizations for their own use or to communicate key results to others
Read what a few of our students have to say about training by Freakalytics
Are you considering attending training by Freakalytics? While nobody is perfect, we are pleased to share that nearly 99% of attendees rated training by Freakalytics as exceeding or meeting their expectations. We have trained a diverse range of people including marketing managers, directors of business intelligence, operations analysts, CFOs, CEOs, data miners, CIOs, business analysts, data architects, senior developers, project managers, hedge fund managers, CMOs, university institutional research directors and others. Here is a sample of attendee comments since 2009.
“There is no substitute for learning at the feet of a master. And I’m not just saying this because I coordinate training for AEA. I’d been using Tableau Software for months. I’d read Stephen’s book. I’d watched Tableau’s free webinars (which are quite good by the way if you’re a Tableau user).”
“However, in four-days of live training I (a) built confidence in the areas where I was on the right track; (b) learned multiple minute details and in particular time-saving shortcuts that only became apparent when seeing someone demonstrate the concepts and software in real time, and (c) moved through roadblocks that I had not been able to surmount via reference manuals and trial-and-error. I’ll now not only be faster, but also more capable and able to produce a better product.”
Susan Kistler, Executive Director, American Evaluation Association
Read her full write-up here
Over on LinkedIn Tableau Enthusiasts Group, Kelly M wrote:
I’ve taken Stephen’s Dashboard workshop at the 2011 conference and it was excellent. Within 15 minutes the guy next to me (Ed) said ‘Well, that trick alone just made the cost for the whole workshop worthwhile.’ The workshop was so well designed that it appeared seamless. That’s a knack that people don’t often get credit for. I judge training based on whether I remember anything later and I can say that I still remember Stephen (and his wife) when I’m building dashboards. Highly, highly recommend any course Stephen offers!
“The best course I have ever taken! In just two-days, I learned so many new ways to communicate with my executive team, thanks!”
— On-site attendee, 2013


 highly experienced speaker!")


American Marketing Association Workshop Attendee Feedback
Below is a summary of attendee comments provided from the AMA survey at the conclusion of our course. Approximately half the attendees gave Stephen the highest possible instructor rating, Excellent, with the balance rating the instructor as Very Good.
– Instructor was knowledgeable and easy to listen to.
– Attendees enjoyed the hands-on aspect especially working with real data.
– The course interactivity was great!
– Students enjoyed hearing Stephen’s business insights and it was very interesting to see how he thinks about data.
About the instructor, Stephen McDaniel
So much data, so little time!
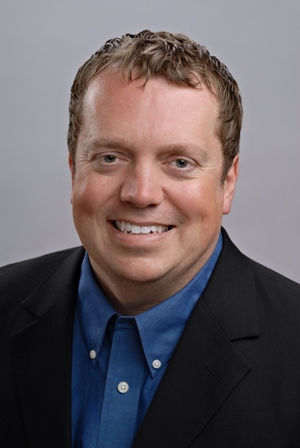 Stephen is Co-Founder and Principal Data Scientist at Freakalytics, LLC. He advises Chief Data Officers and Chief Information Officers on how to develop and implement successful strategies for all aspects of data utilization, from collection to integration to storage to analytics and distribution of findings. He is passionate about projects that bring together people, systems and data resulting in smarter choices, happier customers and higher profits. As an analytics educator with broad experience training thousands of students, he teaches individuals and teams that work with data, regardless of skill level or department, how to manage and analyze data to answer business questions.
Stephen is lead author of SAS for Dummies™ (two editions), Rapid Graphs with Tableau (four editions), the Rapid Dashboards Reference Card and App and co-author of The Accidental Analyst: Show Your Data Who’s Boss. Working with Dr. Eileen McDaniel at Freakalytics, he was the co-founder of Tableau’s worldwide training program, authoring and delivering public and on-site hands-on training in analytics in over 60 cities around the world and at multiple Tableau conferences in the US and Europe.
Stephen has over 25 years of experience as a statistician, analyst, data architect, instructor, data miner, consultant, software innovator and author. He is a faculty member at INFORMS and the American Marketing Association (AMA) and has been a faculty member at The Data Warehouse Institute (TDWI), developing and teaching hands-on courses based on real-world case studies. Many of his courses focus on the emerging techniques of visual analytics and data visualization. He has directly led and provided vision for data warehousing, business intelligence and advanced analytic teams at Tableau Software, SAS Institute, Netflix, Brio Technology, Fidelity Investments, Glaxo, PharmaResearch, IBM, eBay, Paradigm Genetics, Takeda Abbott Pharmaceuticals and Loudcloud. He has worked with or been an invited instructor at leading organizations around the world including Target, State Farm, Eli Lilly, IMS Health, Boeing, American Express, Oracle, Australian Government—Intellectual Property Australia, Duke University, US Navy CyberDefense Operations Command, and The University of Washington at Seattle. When he isn’t analyzing data, you will likely find him hiking in the mountains or visiting wineries with Eileen.
Bala Ganesh, Director of IT at Loudcloud wrote:
Stephen built a successful business intelligence team and data warehouse in world record time!
Chris Stolte, Tableau co-founder and CDO, wrote when Stephen resigned from Tableau as Director of Analytics to return to Freakalytics full-time:
We have benefited greatly from your input, guidance, and effort in the last year and I really appreciate the work you did to help define the product vision.
Endorsing the value of The Accidental Analyst, which Stephen co-authored, Pat Hanrahan, PhD, Canon USA Professor at Stanford University, Co-founder of Pixar and Tableau Software, in his only talk at the Tableau Conference in 2012 explained that the book changed how he thought about analytics and inspired him to develop a new approach to teaching courses at Stanford.
Looking for our upcoming and recorded webinars?
Enjoyed this?
Subscribe to our newsletter and keep up to date on our latest courses, webinars and articles
We promise to:
– Send exclusive content quarterly,
– Never share your info,
– Offer a simple way to unsubscribeUpcoming workshops and speaking engagements