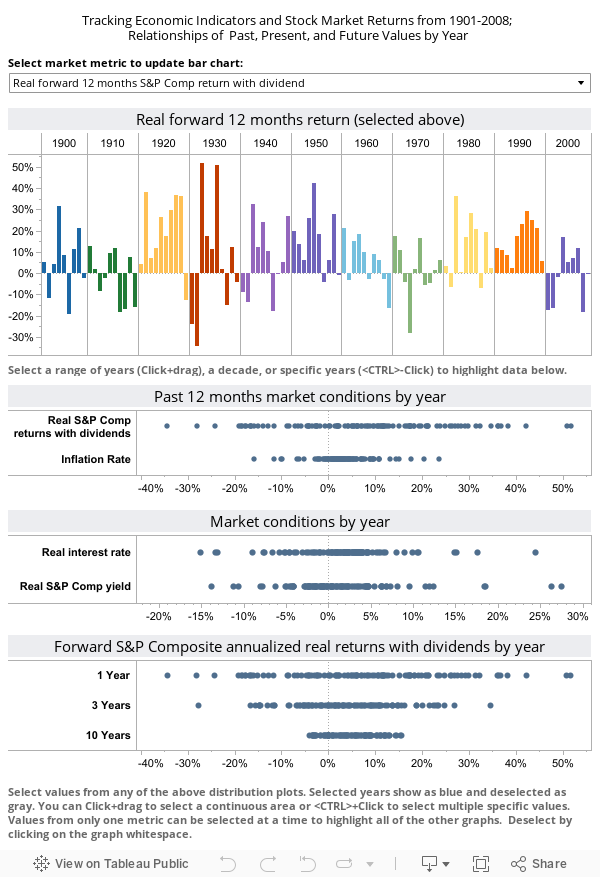
Stephen McDaniel of Freakalytics demonstrates how to display complex relationships between multiple metrics by looking at the stock market patterns relative to economic conditions from 1901-2008.
About this Viz
One means of interacting with this dashboard is data point brushing, highlight data in a part of the dashboard by single-clicking and dragging your mouse across data points of interest.
Exploring this dashboard, it is possible to see that many years of the early 20th century had real dividend rates (due to deflation) of 10-28%. Since 1990, the highest real dividend year for the S&P Composite was a paltry 1%. However, you can see that earlier in the 20th century real dividend yields were very substantial for 25 of the years prior to 1955.