 We are always excited to see new people using visual analytics with data in the public interest. After seeing some great poverty analysis work from the Utah Department of Workforce Services, we wanted to share some ideas that might provide inspiration to them.
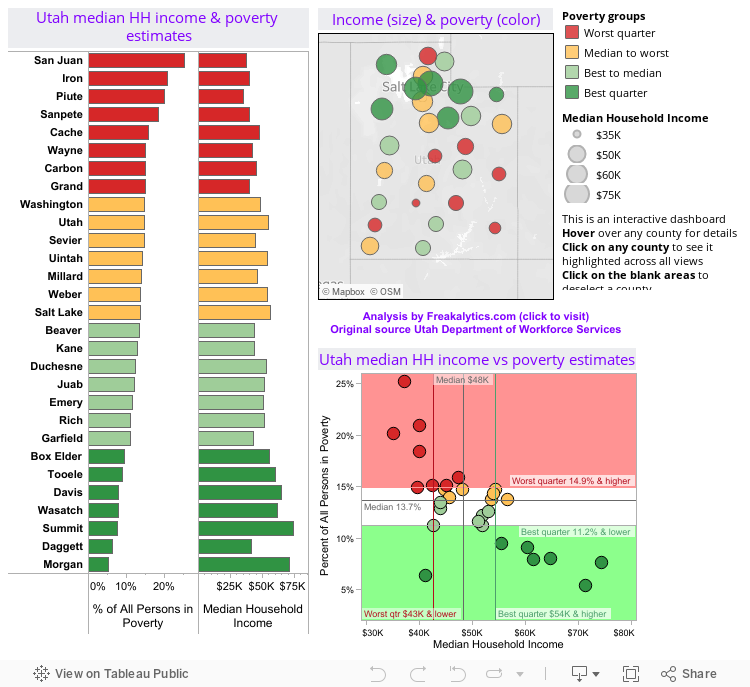
Here is the original chart of poverty rates and median household income by county

Starting from this view, we added the following enhancements:
1) A map of income and poverty rate by county
2) Color coding poverty rates based on quartiles
3) A scatter plot of income versus poverty rate
4) Enhanced the scatter plot with quartiles on both measures
5) Enhanced the tooltips so that they were more readable when people hover over a county
6) In all views, we enhanced labels and set them to only display when highlighted
7) The final step, all the views were brought together in a dashboard. Highlighting was turned on by county for the dashboard.
Keep up the great work Lecia and build even more great analyses with Tableau!
The original post is at http://economyutah.blogspot.com/2011/11/new-2010-small-area-income-and-poverty.html
We hope you enjoy this example of how Tableau can help you create great insights with your data!
Freakalytics is the exclusive source of the original
Complete Tableau Training (4 days) and our new course,
Data Management and Visual Analytics with Tableau (2-days).
For a detailed review of Tableau features, pricing and capabilities, visit PowerTrip Analytics.
For the Tableau Online pricing calculator, click here.
Securely share R shiny apps
Develop R shiny apps
All on one dedicated, secure and powerful platform.