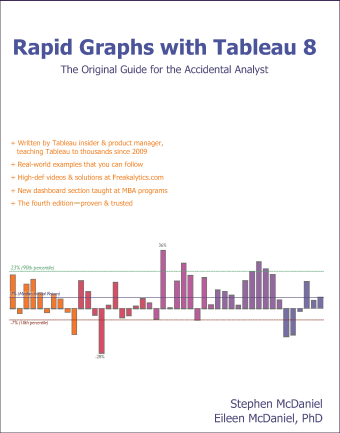
 If you are interested in buying the book, please follow this link.
There are three sample datasets used in the Tableau 8 book that are free for anyone to use, but you must be a registered user of our site to access these downloads. Registration connects us with you so we can keep in touch with you with course schedules, book updates and other topics of interest. You may unsubscribe from the e-mail list at any time by visiting our home page and clicking on the unsubscribe link. Please note that we will never share this registration information with another company.
Please click each link to individually download it.
1. The Winery customers and sales dataset
(note that this is an Excel 2007 file, if you have Excel 2003, you may need to open it in Excel and save it in the older Excel format)
2. S and P Ratings
(a comma-delimited file, commonly referred to as a CSV file)
3. Country GDP per Person Euro
(a zipped file that should be saved and extracted to open a Microsoft Access database
if you are uncertain, select “Save File” when downloading this,
go to the location where you saved it and right-click the file, select “Extract All” and
then navigate to the extracted location)
4. Starting point cheese factory dashboard
(a zipped file that should be saved and extracted to open directly in Tableau 8
if you are uncertain, select “Save File” when downloading this,
go to the location where you saved it and right-click the file, select “Extract All” and
then navigate to the extracted location)
Also, don’t forget to watch the companion videos for the book, Better Analytics with Tableau 8!
Part 1 of Better Analytics in Tableau 8 (Video and Solutions)
+ Multi-item color encoding
+ Multi-item data labels
+ Creating sets in Tableau 8
+ Union, intersection and partial sets; using sets in calculated fields
Part 2 of Better Analytics in Tableau 8 (Video and Solutions)
+ Treemaps and packed bubble charts
+ Automatically selecting the right data for your analysis
+ Forecasting for smarter planning
+ Google Analytics on the desktop–fast, beautiful and blend it with your data
The dashboard video will be posted by June 10th. Thanks for your patience on this last bit!
We hope you have enjoyed the book, samples, videos and solutions. Please keep us in mind for customized, on-site training. We authored and taught the original Tableau training program as the founding Tableau Education Partner, way back in 2009. We have trained thousands around the world including at every major Tableau conference since 2009, the only partner to have taught original Tableau training at their conferences to date. Our training is not offered by Tableau or any other partner, it is exclusive to Freakalytics and is built around the analytic thought process with Tableau as the tool of choice.
All the best,
Stephen McDaniel
Eileen McDaniel, PhD
Securely share R shiny apps
Develop R shiny apps
All on one dedicated, secure and powerful platform.