 If you display information the right way,
anybody can be an analyst.
–JOHN TUKEY
Prominent American statistician
who first used the word “software”
Part 2 Topics
+Treemaps and packed bubble charts
+Automatically selecting the right data for your analysis
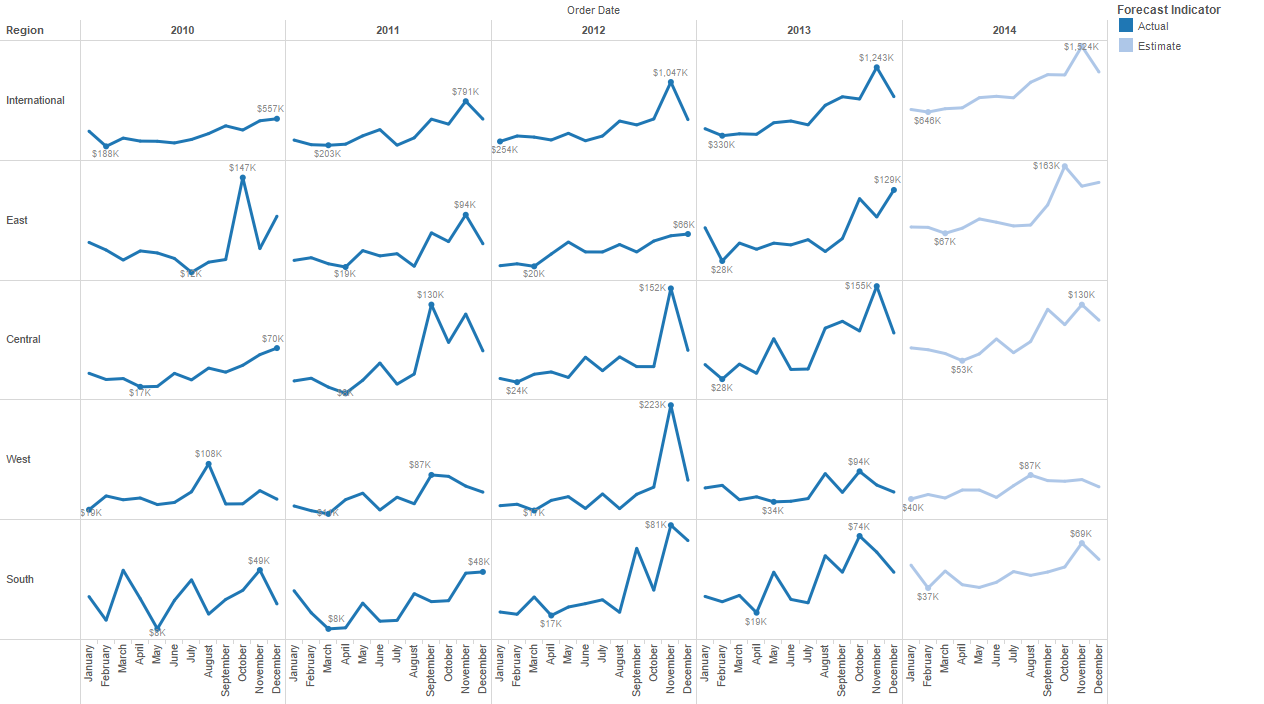
+Forecasting for smarter planning
+Google Analytics on the desktop—fast, beautiful and blend it with your data
The following videos are grouped by topic from our recent webinar, Better Analytics in Tableau 8. The work done in Tableau is also available for download (as a packaged workbook) below the relevant video. Tableau 8 is required to open the packaged workbooks on this page. The videos on this page are available to view in high-quality 1280×720 size, just click the four-arrow box in the bottom right of the video before clicking the play button.
Understanding relative contribution and finding extremes at a glance
Treemaps and packed bubble charts (8:43)
Download the Treemaps and packed bubble charts workbook (requires Tableau 8)
Automatically selecting the right data for your analysis
Data source filters (3:42)